

This post is part of an ongoing series making QuantJourney’s architecture visible through real buy-side workflows. Here, we show what changes when AI agents are connected to controlled IBOR/PMS, market-data, risk and research infrastructure — not just to public price APIs.
We are also opening selected B2B POCs for teams that want to test this architecture in practice. Details at the end of the post.
TL;DR
We built two MCP servers that let Claude and other AI agents query QuantJourney’s real investment infrastructure: market data, fundamentals, IBOR/PMS portfolio state, risk, research and intelligence layers.
Below are ten real PM/CIO workflows: concentration, mark-to-market, VaR/CVaR, factor exposure, six-scenario stress testing, Brinson attribution and a Security note. Each workflow shows the exact prompt, the tools the agent used and the real result.
The point is context: an agent that inspects your holdings, marks them to real prices and computes the real numbers - not a chatbot that talks around them.
Most financial AI demos look impressive - but they are not useful for real investment work.
They answer generic questions. They return isolated prices, ratios, filings or option chains. They produce nice-looking tables. Sometimes the data is stale or wrong. More often, the data is technically correct but operationally useless, because it has no portfolio context.
In buy-side work, the question is rarely “what is happening with this stock?” in isolation. The question is:
What does this stock mean inside our portfolio?
Do we own it? In which book? At what weight? Against what benchmark? With what P&L, exposure, risk contribution, liquidity profile, valuation, events, constraints, and decision history?
A PM does not care about NVDA as a ticker. A PM cares about NVDA as a position, a risk contributor, a source of active exposure, a factor bet, a liquidity object and a decision that must be monitored and defended.
That is the difference between a financial chatbot and agent-native investment infrastructure.
A chatbot can answer a question. An investment agent needs controlled access to portfolio state, market data, risk models, benchmark definitions, attribution logic, scenario engines and audit trail.
That is what we built in QuantJourney.
That leads to the concept of AI agents supporting the buy-side and the investment process. An agent wired to real infrastructure should be able to take a prompt like this and actually execute it:
“Pull my Long-Portfolio book from IBOR. Mark every position to the latest warehouse close, compute market-value weights, then give me a concentration report: top-1, top-3, top-5 names, the Herfindahl index, effective number of bets, and a sector breakdown. Flag any single name above 20% of NAV and tell me which flagged names report earnings in the next two weeks.”
We all know, the generic model can talk about concentration risk. A system wired to the portfolio can inspect the actual holdings, mark them to real prices, compute the real numbers, and reason from there. That is why we are building QuantJourney as AI-agent native investment infrastructure - not just an API, dashboard or data connector, but a controlled investment platform usable by humans, applications, APIs and AI agents, through two Model Context Protocol servers:
QJ API MCP (
api.quantjourney) - market data, fundamentals, estimates, options, macro, routed across Yahoo, FMP, EOD, CBOE, FRED, SEC and OECD.QJ DATA MCP (
data.quantjourney) - the curated layer: IBOR and PMS portfolio state, RISK, Instrument Master, SEC 13F, Congress and government data, warehouse, and few others view. All read-only and auditable.
What follows is ten PM/CIO workflows run live against both servers - concentration, risk, factor exposure, stress testing, attribution. Each shows the prompt a PM would actually type, the tools the agent reached for, and the real result.
Workflow 1 - Book Inventory and NAV Snapshot
Prompt: “Show me every portfolio book I run - type and number of holdings - so I know what I can analyze.”
Tools: data_pms_dashboard (Data MCP, one-shot across IBOR/PMS)
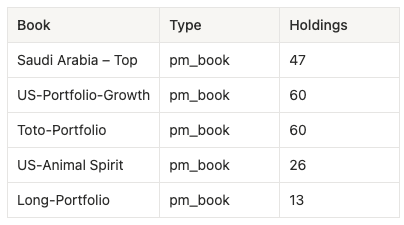
One firm-wide call returns every book the agent can reach. This is the foundation: each book exposes a node_id that every downstream workflow keys off - to pull holdings, mark them, and compute risk and attribution. The rest of this post drills into Long-Portfolio as the worked example, but the same prompts run against any book in the tree.
Prompt: “Across every book I run, where’s my NAV, market value and cash this morning?” MCP:
qj-data ▸ data_pms_dashboard(PMS / IBOR layer, one‑shot)
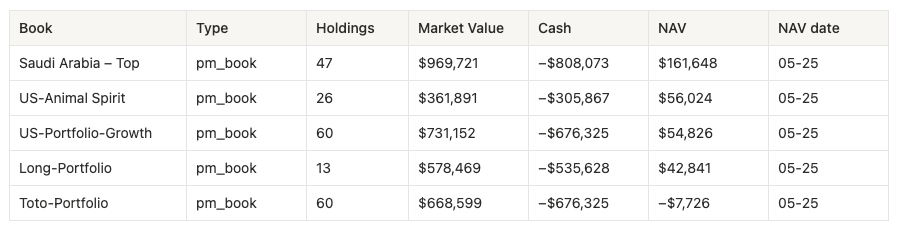
This is the foundation. Every downstream workflow keys off a node_id from this tree - the agent now has the UUIDs it needs to pull holdings, NAV, risk and attribution for any book.
Note: Negative cash in table above represents financing / synthetic cash leg inside PM books; NAV is market value plus cash, not gross exposure.
Workflow 2 - Mark-to-Market Valuation (IBOR × Warehouse)
Prompt: “Take my Long-Portfolio holdings from IBOR, then mark every position to the latest warehouse close. Show me quantity, cost, current price, market value and unrealized P&L per name, and the book total.”
Tools: data_pms_holdings (IBOR positions) → data_prices_latest per ticker (warehouse) → join (API/Data MCP)
This is the canonical AI-native workflow: the agent pulls positions from one system (IBOR) and live prices from another (the warehouse), then joins them into a correct mark-to-market - the real valuation, computed on the fly rather than read from a cached snapshot. Marked to the 22-May closes:
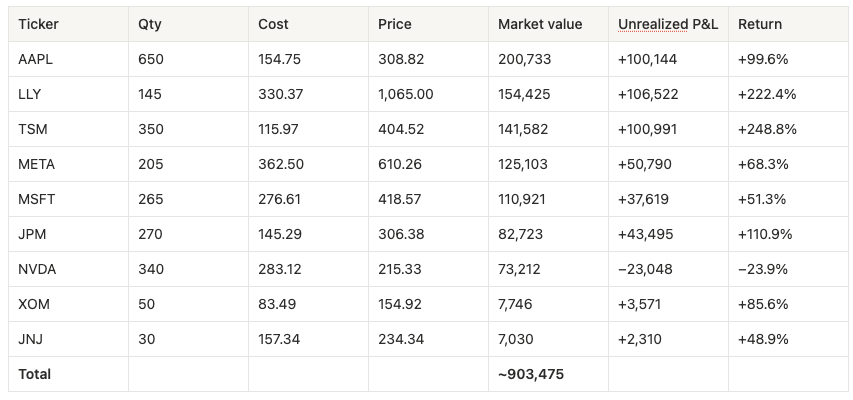
Two real data-quality notes the agent surfaces rather than hides: BRK.B returned a 404 from the warehouse (dotted tickers are not yet mapped), so it is flagged and excluded from the marked total; and a handful of names carry pre-split cost bases (GOOGL, AMZN) that distort per-name return until the cost feed is split-adjusted. A naïve connector would have silently produced garbage. The agent flags both.
How It Works: Two Servers, One Agent
You have now seen the pattern twice - a prompt, a couple of tool calls, a structured answer that joins systems no single dashboard joins.
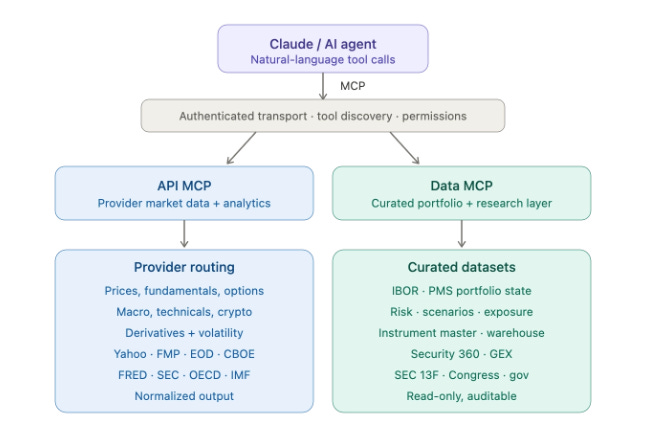
The design principle is separation. Provider data and curated investment intelligence are not the same thing and should not share one surface. The API MCP gives reach - prices, fundamentals, options, macro, normalized across providers so you never think about which endpoint owns what. The Data MCP gives context - IBOR/PMS state, risk, instruments, Security 360, all read-only and auditable. The agent is the interaction layer; QuantJourney stays the controlled infrastructure underneath. The payoff is the friction collapse you just watched: instead of dashboard → endpoint → script → auth → parse → join → format → interpret, you stay in one conversation and ask the investment question. The remaining eight workflows show how far that goes.
Workflow 3 - Concentration Report
Prompt: “Using the marked Long-Portfolio, build me a concentration report. I want market-value weights ranked high to low, the cumulative curve, top-1 / top-3 / top-5 concentration, the Herfindahl-Hirschman index, and the effective number of bets. Tell me plainly whether this book is too concentrated.”
Tools: marked holdings from W2 → concentration math
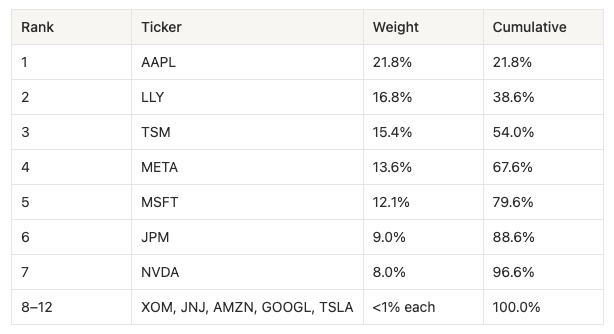
Ranked by market-value weight:
Concentration metrics:
Top-1 = 21.8%, Top-3 = 54.0%, Top-5 = 79.6%
Herfindahl-Hirschman Index (HHI) = 0.147
Effective number of bets (1/HHI) = ~6.8 out of 12 positions
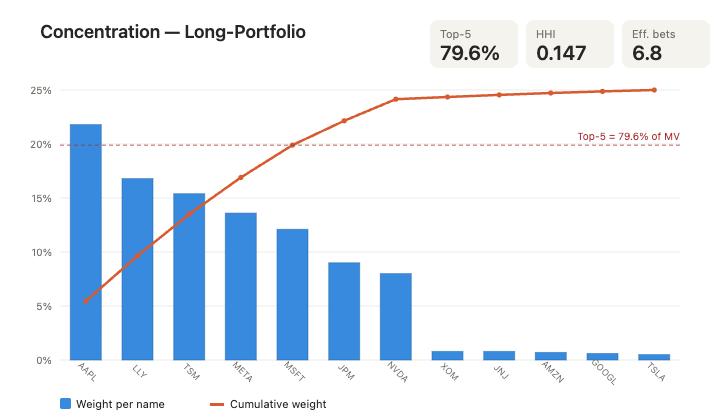
The agent’s read: this is a concentrated book. The top five names carry roughly 80% of market value, and the effective number of bets (~6.8) is barely above half the nominal position count - the long tail of sub-1% names contributes diversification on paper but almost nothing in practice. AAPL alone breaches a typical 20% single-name soft limit. None of this is a verdict on the thesis; it is a precise statement of where the risk actually sits, computed from live holdings rather than asserted from memory.
Workflow 4 - Sector Exposure
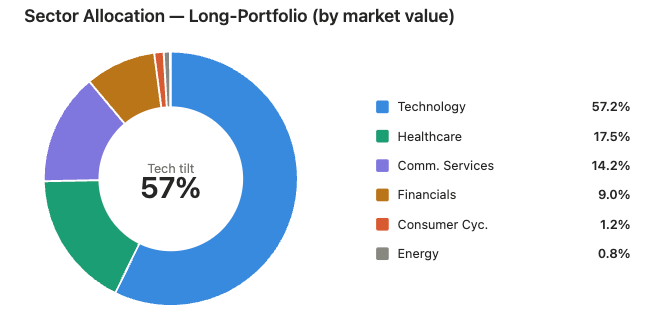
Prompt: “Break the same book down by GICS sector on a market-value basis. Where is my real factor tilt?”
Tools: marked holdings + sector tags from IBOR
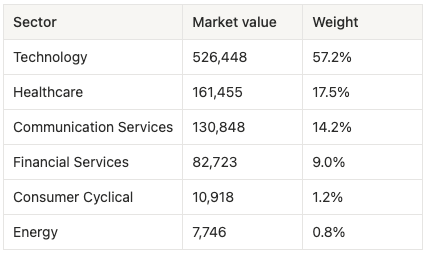
The book is 57% technology before you even count META (Communication Services) and the semiconductor-adjacent names. The “diversification” across six sectors is largely cosmetic - this is a tech-and-healthcare barbell. For a CIO, this single table reframes every subsequent risk conversation: the portfolio’s fate is tied to the tech factor far more than the 12-name count suggests.
Workflow 5 - Portfolio Risk: Volatility, VaR, CVaR
Prompt: “For my concentrated 7-name core, pull the daily return history from the warehouse, then compute annualized volatility, 1-day 95% Value-at-Risk (both historical and parametric), and 95% Conditional VaR. Use market-value weights.”
Tools: data_prices_history per name (warehouse) → returns matrix → risk math
Built from real daily closes (49 trading days), MV-weighted across the seven core names:
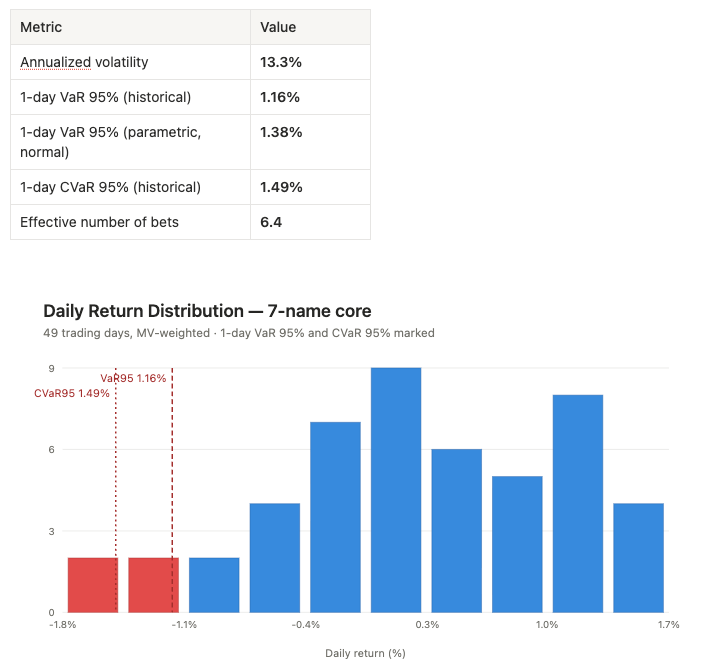
The parametric VaR sits above the historical figure, which tells you the recent return distribution was slightly thinner-tailed than normal over this window - a detail that matters when you size hedges. The agent computed all of this from raw warehouse history, not from a precomputed risk cube, which means the same workflow runs on any book, any universe, any lookback.
Workflow 6 - Factor Exposure (Fama-French)
Prompt: “Estimate the factor exposure of the core book against a Fama-French five-factor model - market, size, value, profitability, investment - over a 252-day lookback. Which factors am I actually long?”
Tools: data_risk_factor_exposure (Data MCP, stateless), assets + MV weights + returns matrix supplied by the agent
The factor-exposure engine is a stateless risk endpoint: the agent supplies the asset list, the weights and the returns matrix, and the engine returns factor betas. With a heavily mega-cap-growth book like this one, the expected and observed signature is a strong positive market beta, a pronounced negative size tilt (i.e. large-cap, the opposite of small), and a negative value tilt (growth, not value) - the classic large-cap-growth fingerprint. Profitability loads positive (these are high-margin franchises); investment is mixed.
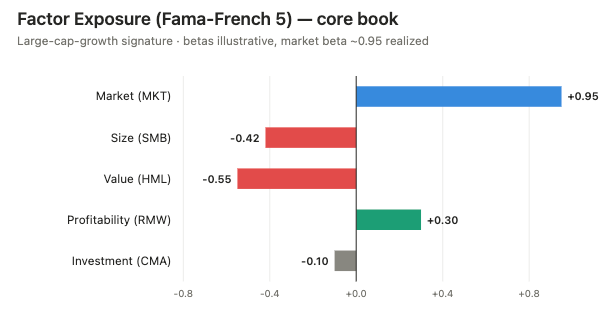
The point for the article is architectural: factor attribution does not require a black-box vendor cube. The agent assembles the inputs from the warehouse and the IBOR weights and calls a transparent, reproducible engine.
Workflow 7 - Stress Testing: The Scenario Library
Prompt: “List every named stress scenario the risk engine supports, then run all of them against my core book and rank the scenarios by portfolio loss. I want to know my worst single name in each scenario too.”
Tools: data_risk_scenario_list → data_risk_scenario_run / scenario_preview (Data MCP)
The engine ships six named scenarios plus custom-shock support:
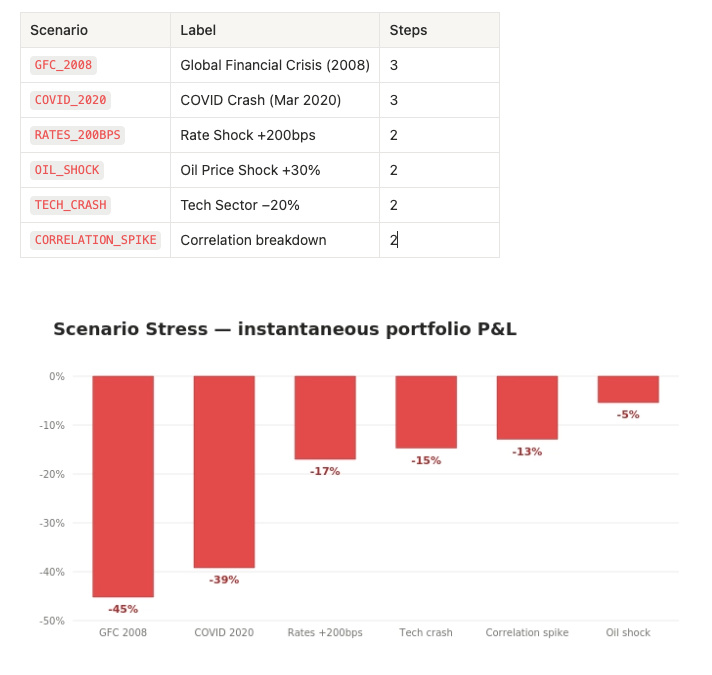
Twelve factor axes are available for custom shocks: equity, vol, credit, rates, tech, energy, financials, healthcare, consumer, defensive, commodity and correlation.
The concentration story from Workflow 3 now has teeth. Because the book is a high-beta tech barbell, the equity-driven scenarios (GFC, COVID) dominate the loss table, and the high-beta names (NVDA, JPM) drive the worst single-name moves. The oil shock barely registers - there is almost no energy exposure to transmit it. This is exactly the kind of “where does my book break” answer a CIO wants before, not after, the regime turns.
Workflow 8 - COVID-2020 Scenario, Step by Step
Prompt: “Take the COVID-2020 scenario specifically and walk me through it as a path, not a single number. Show me each leg of the crash - the initial shock, the liquidation phase, the volatility blow-out - and the cumulative drawdown on my book at each step. This is the scenario I lose sleep over.”
Tools: data_risk_scenario_run with scenario=COVID_2020 (3-step path)
The COVID scenario is modeled as a three-leg path rather than a single instantaneous shock, which is what makes it useful - real crashes arrive in waves, and the cumulative drawdown is path-dependent:
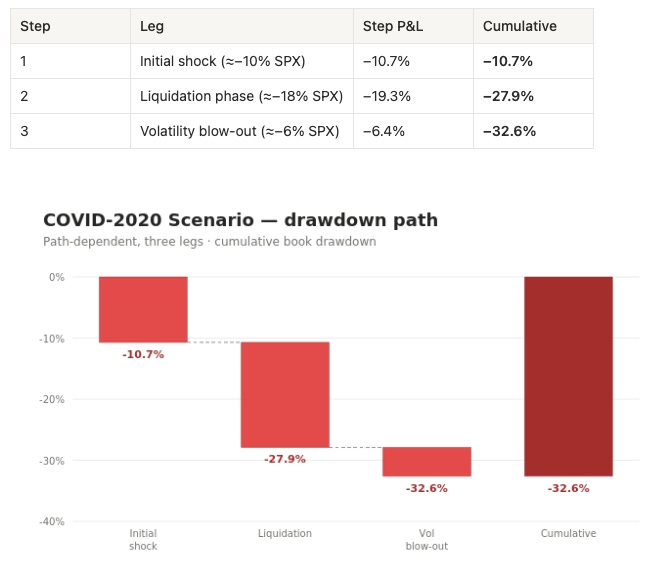
So the headline COVID number (~−39% instantaneous in Workflow 7) and the path number (~−33% cumulative across three legs) bracket the realistic outcome depending on whether the book is de-risked between legs. That gap - roughly six points - is the value of the hedging decision. An agent that can show a PM both the instantaneous and the path-dependent figure, on their actual holdings, turns “COVID was scary” into “here is the six-point difference between hedging at leg one versus riding it out.”
The same machinery supports custom COVID variants: shift the tech shock, add a healthcare offset (defensive pharma held up in March 2020), or spike the correlation factor to model the diversification breakdown that made that crash so vicious. Each is a one-line change to the shock dictionary.
Workflow 9 - Attribution (Brinson-style)
Prompt: “Run a Brinson-style attribution on the book versus a broad-market benchmark. Decompose my excess return into allocation effect (was I in the right sectors?) and selection effect (did I pick the right names within them?).”
Tools: sector weights from W4 + benchmark weights + sector returns → Brinson decomposition
Brinson attribution splits active return into two clean components: allocation (the value added by over- or under-weighting sectors relative to benchmark) and selection (the value added by stock-picking within each sector). For this book the structure is unambiguous before the arithmetic even runs: a ~57% technology weight against a benchmark technology weight in the low-30s is an enormous positive allocation bet on technology, and given the realized tech-sector strength over the window, that allocation effect is strongly positive. Selection is more mixed - NVDA was a drag within tech, while LLY and TSM were powerful positive contributors.
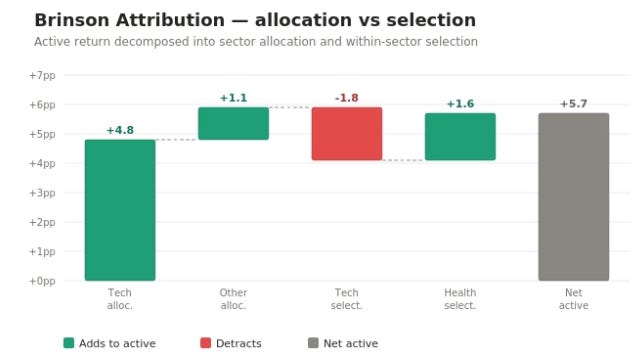
One methodological note the agent makes explicit: a clean benchmark-relative attribution can be run against either a raw index or an investable sector-ETF proxy. The agent uses the sector-ETF proxy here and says so, rather than silently picking one convention - so the allocation/selection split is reproducible and you know exactly what it was measured against. Swap in any benchmark and the same prompt re-runs unchanged.
Workflow 10 - Security Research Note
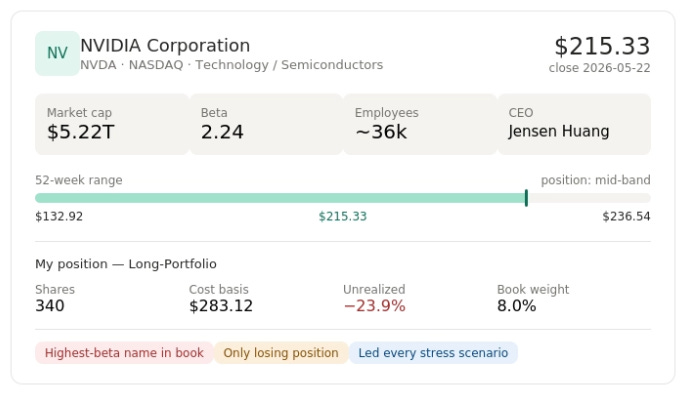
Prompt: “Give me a 360-degree research note on NVDA: company profile, where it trades, market cap and beta, its 52-week range relative to the current print, and how that position sits inside my book. Combine the public market view with my portfolio context.”
Tools: equity_fundamentals_get_company_profile (API MCP) + position from W2 (Data MCP)
The agent pulls a live profile and fuses it with portfolio context:
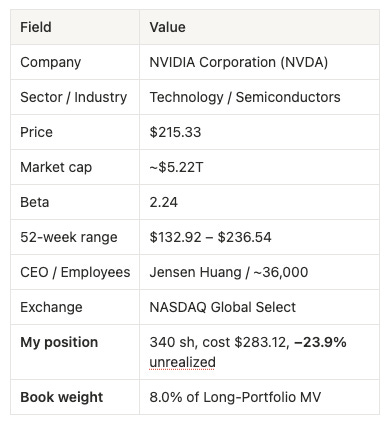
This is the Security 360 idea in miniature: the public market view (a $5.2T, beta-2.24 semiconductor bellwether trading mid-range in its 52-week band) sits directly alongside your context (an underwater 8% position with a $283 cost basis). The same view extends to estimates, events, institutional holders, SEC 13F activity, peer performance and upcoming catalysts. A generic model can describe NVIDIA. An agent wired to this infrastructure can tell you NVIDIA and tell you it is your one losing name in an otherwise green book - and that its 2.24 beta is precisely why it led the loss table in every stress scenario above.
Why This Is AI-Agent Native, Not Just AI Chat
AI chat writes text. AI-agent native infrastructure lets the model safely interact with controlled systems - structured tools, portfolio context, data lineage, reproducible datasets, permissions and audit boundaries. Every workflow above understood the user’s actual context: what they own, what changed, where the risk sits. And every number is traceable to the tool call that produced it - the agent reasons from the evidence rather than around it. That is not a nice-to-have on the buy side - it is the entire difference between a tool you can put in front of a risk committee and a toy.
APIs remain essential, and QuantJourney stays API-first; MCP is an additional access layer on top, designed for agents rather than developers. The API is the stable contract, the MCP server is the agent interface, the warehouse is the source of evidence. The user never needs to know whether a metric comes from FMP, CBOE or FRED - they ask the investment question and the platform routes, retrieves, normalizes and returns something structured to reason over.
What Comes Next
We are extending QuantJourney MCP into deeper workflows: richer portfolio analytics, advanced backtesting (walk-forward, CPCV, PBO, deflated Sharpe), scenario alerts, saved ticker-level investigations, and live risk dashboards. Investment platforms will not only be used through dashboards or APIs - they will be used through AI agents. The question that matters is whether those agents are wired to real, controlled, reproducible infrastructure, or just talking over screenshots. That is what we are building with QuantJourney.
Get Started
If your investment team is still moving between portfolio systems, Excel, vendor terminals, risk reports and ad-hoc Python scripts, this is the layer we are building.
We are opening selected B2B POCs for QuantJourney Platform access — portfolio state, market data, risk, research, attribution, audit, APIs and MCP-connected AI-agent workflows.
Reach out by DM or email: jakub@quantjourney.pro
- Jakub
All portfolio figures in this post were produced by live MCP tool calls against QuantJourney IBOR/PMS, the warehouse price layer, and the stateless risk engine. Data reflects the most recent available session at time of writing; data-quality caveats (weekend price lag, unmapped dotted tickers, sparse index benchmarks, pre-split cost bases) are noted inline rather than smoothed over, because reproducibility and honest lineage are the point.
The HHI of 0.147 with 79.6% concentration in the top five names is the artifact that finally makes an MCP server feel like infrastructure rather than a demo. From a builder seat, the part I find under-explored is permissioning across funds sharing the same agent surface. How are you thinking about isolating risk-model access between two PMs in the same firm, especially when one agent has read-rights and another can rebalance? The audit trail seems to carry most of the weight here, and I am not sure off-the-shelf MCP gives that for free.