


Funding Rates in Crypto: The Hidden Cost, Sentiment Signal, and Strategy Trigger

At QuantJourney, we’re actively building an advanced API platform for crypto data, focused on systematic trading, signal generation, and quant research. This post kicks off a new series on key crypto trading mechanics, starting with one of the most powerful and misunderstood metrics: funding rates.
We’ll break them down - how they work, why they matter, how to read them, and how to build tools around them. You’ll also get a full Python implementation that streams live Binance funding rates in real-time.
What Are Funding Rates?
Funding rates are periodic payments exchanged between traders in perpetual futures markets, designed to keep the futures price close to the spot price. This mechanism exists because, unlike traditional futures contracts, perpetuals have no expiry date.
This makes them incredibly attractive for traders seeking leverage without rollover complexity. But it also introduces systematic costs and risks that many underestimate.
The basics:
Spot Price: This is the current market price at which an asset (like Bitcoin or Ethereum) can be bought or sold for immediate delivery. Think of it as the "real" price you see on a regular exchange.
Futures Contract: This is an agreement to buy or sell an asset at a predetermined price on a specific future date.
Perpetual Futures: Unlike traditional futures, perpetual futures do not have an expiry date. This means you can hold them indefinitely, similar to holding the underlying asset itself. This is why they are incredibly popular in crypto trading, offering leverage without the complexities of rolling over contracts.
How Funding Rates Work:
Funding rates stabilize perpetual futures by penalizing overcrowded positions, ensuring price alignment with the spot market. Every 8 hours on most exchanges (e.g., Binance), a funding payment occurs:
Positive Rate: Longs (buyers) pay shorts (sellers) when the futures price exceeds the spot price, indicating bullish sentiment.
Negative Rate: Shorts pay longs when the futures price is below the spot price, signaling bearish sentiment.
Payments occur every 8 hours by default, shifting to hourly after rates hit the cap/floor (±0.3% for BTCUSDT, as of May 2025).
While powerful, funding rates should be used in combination with volume, open interest, and basis spreads to avoid false positives in volatile conditions.
Binance’s Formula:
Binance does not charge a platform fee on funding payments - these are directly exchanged between traders. However, the effect on your PnL can be significant.
Funding Rate = Average Premium Index + clamp(Interest Rate - Premium Index, -0.05%, 0.05%)
Premium Index: Measures price divergence between futures and spot, updated every 5 seconds.
Interest Rate: Fixed at 0.01% per 8 hours (0.03% daily), except for pairs like ETHBTC (0%).
Cap/Floor: E.g., ±0.3% for BTCUSDT, ensuring rates don’t spiral excessively.
Why Funding Rates Exist:
Perpetual futures need a mechanism to tether their price to the spot market, as they lack expiry. Funding rates act as a dynamic “interest rate,” balancing long and short demand:
Bullish Market → Futures price > Spot → Longs pay shorts
Bearish Market → Futures price < Spot → Shorts pay longs
This dynamic incentivizes balance in the market by making one side more expensive when it's overcrowded.
Think of funding as a dynamic interest rate - it rises when too many traders are on one side of the market.
Interpreting Funding Rates: What They Really Mean
Funding rates offer a real-time glimpse into trader behavior, leverage, and market imbalance.
1. Market Sentiment Gauge
+0.01% to +0.05% - Bullish sentiment, possibly overleveraged longs
-0.01% to -0.03% - Bearish pressure, heavy shorting, possible reversal zone
> +0.1% or < -0.1% - Market stress, high volatility, potential liquidation risk
Spikes in funding often indicate aggressive positioning and can precede pullbacks or squeezes.
2. Leverage Insight
Funding rate magnitude correlates with leverage. A sustained +0.05% rate translates to ~54.75% annual cost for longs - unsustainable unless price appreciation is extreme.
3. Trading Signal
Funding rates are often used in contrarian strategies:
High positive → Market overcrowded with longs → Short opportunity
Deep negative → Shorts overloaded → Possible short squeeze
These are mean-reversion edge cases that quant traders frequently exploit.
4. Strategic Cost Management
Even a small 0.01% fee, when applied 3 times a day for a full year:
Annualized = 0.0001 × 3 × 365 = 0.1095 → 10.95%
That’s a significant hidden cost on long-term or leveraged positions. Managing entry/exit based on funding is essential.
5. Volatility Forecasting
Sudden funding spikes often precede sharp price movements - acting as a leading indicator of volatility and liquidation risk.
Annualizing Funding Rates: Understanding the Long-Term Impact
yearly_rate = funding_rate × 3 × 365
3 = Three 8-hour periods in a da
365 = Number of days per year
Example:
If funding_rate = 0.0001 (0.01%):
yearly_rate = 0.0001 × 3 × 365 = 0.1095 → 10.95%
This doesn’t mean you’ll pay this exact amount - funding rates fluctuate - but it provides a normalized metric for evaluating cost/return over time.
How to Use This Data
Example Market Snapshot:
Symbol8h RateAnnualizedSignalBTCUSDT+0.05%~54.75%Overheated long crowdETHUSDT-0.02%~-21.9%Short squeeze potential
This real-time insight helps:
Adjust position sizing
Enter during favorable rates
Exit when funding cost is extreme
Python Script to Fetch and Display Funding Rates
Our script connects to Binance’s WebSocket API to fetch real-time funding rates and displays them in a clear terminal table using the Rich library. It’s lightweight, requires no API keys, and is ideal for traders wanting quick insights.
Connecting to Binance WebSocket
Binance provides a robust real-time WebSocket API for market data. In our case, we use a specific endpoint to access mark price and funding rate information.
The general endpoint structure is:
wss://fstream.binance.com/ws/{symbol}@markPrice
Let's break down this URL:
wss://: This indicates a secure WebSocket connection.fstream.binance.com: This is the domain for Binance's futures market data streams./ws/: The path indicating a WebSocket service.{symbol}: A placeholder for the trading pair you're interested in. This must be in lowercase.@markPrice: This specifies the stream type. ThemarkPricestream provides the current mark price, estimated funding rate, and next funding time for a given symbol. This is exactly what we need for funding rates.
For example:
To get funding data for BTCUSDT (Bitcoin against Tether), we connect to:
wss://fstream.binance.com/ws/btcusdt@markPrice
To get data for ETHUSDT (Ethereum against Tether), it would be:
wss://fstream.binance.com/ws/ethusdt@markPrice
When you connect to this WebSocket, Binance will continuously send JSON messages with updated data. The key fields from these streamed messages that are relevant to our script are:
s: Symbol (e.g.,BTCUSDT,ETHUSDT,SOLUSDT). This tells you which asset the data belongs to.r: Latest funding rate (in decimal form, e.g.,0.0001which translates to0.01%). This is the raw funding rate for the current 8-hour period.E: Event time (in milliseconds since epoch). This timestamp indicates when the data was generated on Binance's servers, crucial for knowing how fresh your data is.
import asyncio
import websockets
import json
from rich.console import Console
from rich.table import Table
from datetime import datetime

console = Console()

# List of symbols to track
symbols = ['btcusdt', 'ethusdt', 'solusdt', 'bnbusdt']

# Build the WebSocket URLs for each symbol
urls = [f"wss://fstream.binance.com/ws/{symbol}@markPrice" for symbol in symbols]

# Store latest funding data
funding_data = {}

def convert_timestamp(ms):
    return datetime.utcfromtimestamp(ms / 1000).strftime('%Y-%m-%d %H:%M:%S')

def display_table():
    table = Table(title="🔄 Live Funding Rates (Binance)", expand=True)
    table.add_column("Symbol", justify="left", style="cyan")
    table.add_column("Funding Rate", justify="right", style="magenta")
    table.add_column("Annualized", justify="right", style="green")
    table.add_column("Timestamp", justify="right", style="yellow")

    for symbol, data in funding_data.items():
        rate = float(data["r"])
        yearly = f"{rate * 3 * 365 * 100:.2f}%"
        timestamp = convert_timestamp(data["E"])
        table.add_row(symbol.upper(), f"{rate * 100:.4f}%", yearly, timestamp)

    console.clear()
    console.print(table)

async def handle_stream(url):
    async with websockets.connect(url) as ws:
        while True:
            msg = await ws.recv()
            data = json.loads(msg)
            symbol = data["s"].lower()
            funding_data[symbol] = data

async def main():
    tasks = [handle_stream(url) for url in urls]

    # Launch display task separately
    async def refresh_display():
        while True:
            display_table()
            await asyncio.sleep(2)

    await asyncio.gather(*tasks, refresh_display())

if __name__ == "__main__":
    try:
        asyncio.run(main())
    except KeyboardInterrupt:
        console.print("\\n[red]Stopped by user.[/red]")
which will produce
Why Monitor Funding Rates?
Funding rates are more than just numbers - they provide profound insight into market sentiment and can be a powerful tool for traders and analysts:
High positive rates mean more demand for longs - often a strong bullish bias. When many traders are eager to be long, they are willing to pay a premium. This can be a sign of exuberance.
Negative rates imply shorts dominate, which can be bearish or, paradoxically, contrarian bullish (depending on context). If funding rates are deeply negative, it means a lot of people are betting on prices going down. This can sometimes precede a "short squeeze," where the price unexpectedly rises, forcing shorts to cover their positions, further accelerating the price increase.
Spikes in funding may signal overleveraged traders, which can precede volatility. A sudden jump in funding rates might mean a large number of highly leveraged positions have been opened, making the market more susceptible to large price swings if those positions are forced to liquidate.
Many quantitative strategies use funding rate signals as part of their decision logic. For example, some strategies might look to short assets with very high positive funding rates, anticipating a reversion to the mean or a market correction. Conversely, they might look for long opportunities when funding rates are very negative, expecting a short squeeze.
Understanding Funding Rate Edge Cases
While funding rates generally reflect supply/demand for leverage, certain edge cases can cause spikes or unusual behavior:
Liquidity Drying Up: During periods of extreme volatility or low trading volume, the market makers providing liquidity for perpetual futures might pull back. This can lead to exaggerated price discrepancies between futures and spot, causing funding rates to spike dramatically as the mechanism works harder to correct the basis.
Scheduled Events: Major economic announcements, crypto-specific events (e.g., network upgrades, halving events), or even exchange-specific maintenance can sometimes disrupt normal market functioning, leading to temporary funding rate anomalies.
Flash Crashes/Pumps: Rapid, significant price movements can trigger cascades of liquidations, which in turn can create momentary extreme funding rates as positions are closed or new ones are opened aggressively.
What Can You Build with This?
The real-time funding rate data streamed by this script is a powerful foundation for numerous applications:
Automated Alerting System:
Concept: Configure custom thresholds for funding rates. If an annualized rate exceeds a specific positive or negative percentage (e.g., BTCUSDT annualized rate above
+40%or below20%), trigger an immediate notification.Implementation: Integrate with popular messaging platforms like Telegram, Slack, or Discord using their respective bot APIs or webhooks. This provides instant awareness of significant market shifts, allowing you to react quickly to opportunities or risks.
Historical Data Logger for Backtesting:
Concept: Continuously log the streaming funding rate data to a database optimized for time-series data. This allows you to build a comprehensive historical dataset for in-depth analysis and strategy development.
Implementation: Use databases like InfluxDB (designed for time-series), TimescaleDB (a PostgreSQL extension), or even a simpler SQLite database for smaller-scale projects. This historical data is invaluable for validating trading hypotheses and refining your quantitative models.
Algorithmic Trading Strategy Signal Generator:
Concept: Develop sophisticated algorithms that generate buy/sell signals based on real-time funding rate dynamics. For instance, a strategy might go short when funding rates are extremely positive, anticipating a reversal, or go long during extreme negative rates, expecting a short squeeze.
Implementation: Incorporate your strategy logic directly into the data processing part of your script. This can range from simple if/then conditions to more complex statistical models that react to funding rate changes.
Arbitrage Opportunities:
Earn negative rates by longing futures and shorting spot markets, locking in funding payments. E.g., long ADAUSDT at -0.01% while shorting spot.
Portfolio Management:
Allocate capital to assets with favorable rates, like longing assets with negative rates to earn funding, avoiding high positive rates.
Interactive Funding Rate Visualizer (Web/Desktop):
Concept: Move beyond the terminal. Use Python's powerful visualization libraries to create dynamic charts and heatmaps that display funding rate trends across multiple assets over time.
Implementation: Pair the data stream with libraries like
matplotlib,seaborn, orplotly. You could build a lightweight web dashboard using frameworks like Flask or Dash to serve these visualizations in real-time in a browser, offering a more intuitive way to spot trends.
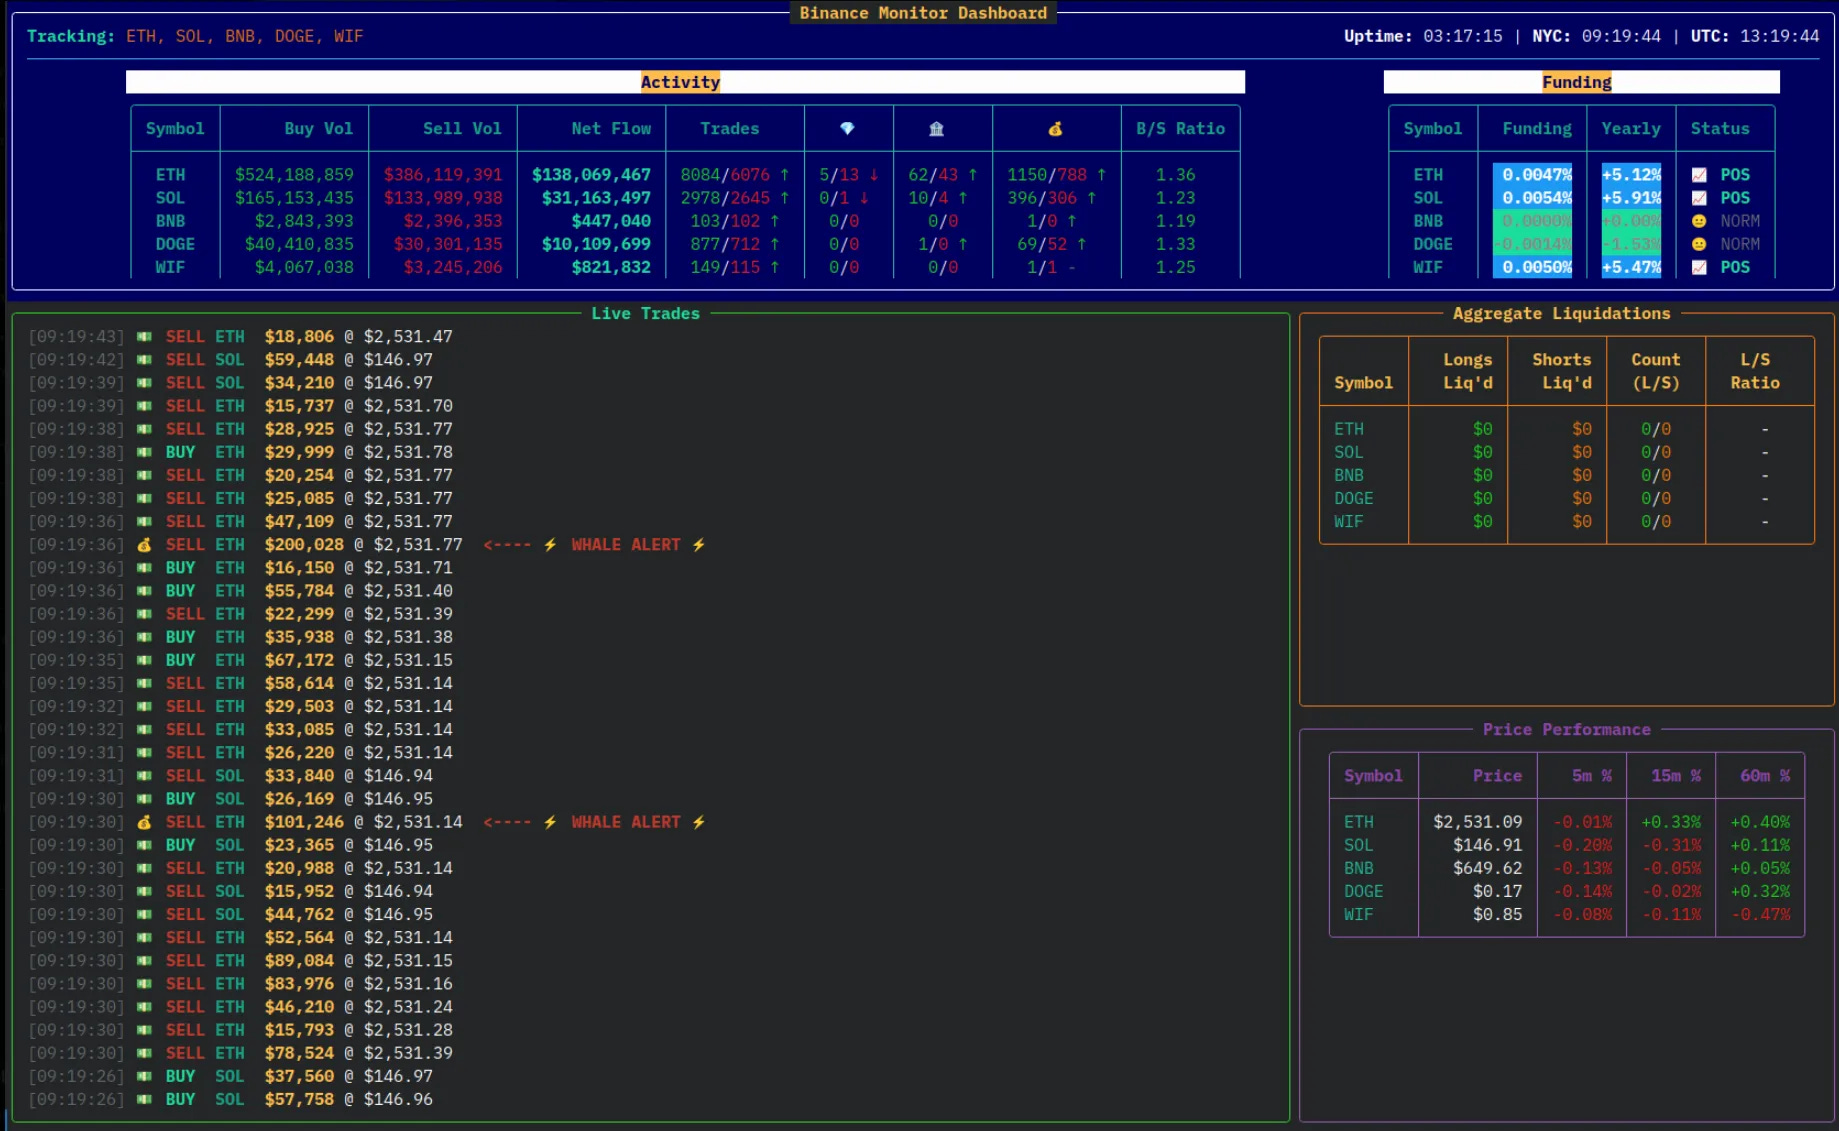
See some of our examples:

Or here’s another one, built by a participant in our Crypto Bot Training program, currently led by Alex:
Summary
Funding rates are far more than a technicality - they are a real-time window into market sentiment, leverage imbalance, and trader positioning. Understanding them gives you an edge not only in risk management, but also in spotting regime shifts and timing high-probability entries and exits.
Happy Trading!
Jakub